Key Responsibilities
- Rapid Prototyping: Conceptualized and coded the entire application over a single weekend, managing the full stack from data input logic to the graphical interface.
- Algorithm Design: Developed the “Time to Purchase” algorithm, which dynamically calculates how many months of savings are required for specific wishlist items based on real-time expense adjustments.
- Custom UI Development: Implemented a coordinate-based GUI using
graphics.pyto create a proportional stacked bar chart, visualizing exactly where every dollar of the monthly budget is allocated.
Hackathon Challenges & Logic
Competing in the Freshman category required demonstrating both technical proficiency and a working product within the 36-hour window.
- Data sanitization: I focused on creating a robust input loop (
input_info) that could handle various user inputs without crashing—a critical factor during the live demo for the judges. - Visual Logic: Since I was not aware of UI libraries/frameworks and worked in haste, instead of using pre-made charting libraries, I wrote the rendering logic from scratch. This involved normalizing the expense data to fit the 1000px canvas and mathematically calculating the x/y coordinates for the dynamic bars and text labels. This involved a decent amount of math and energy drinks.
- The Winning Factor: The project was recognized for its clean execution and practical utility, effectively gamifying the saving process for students.
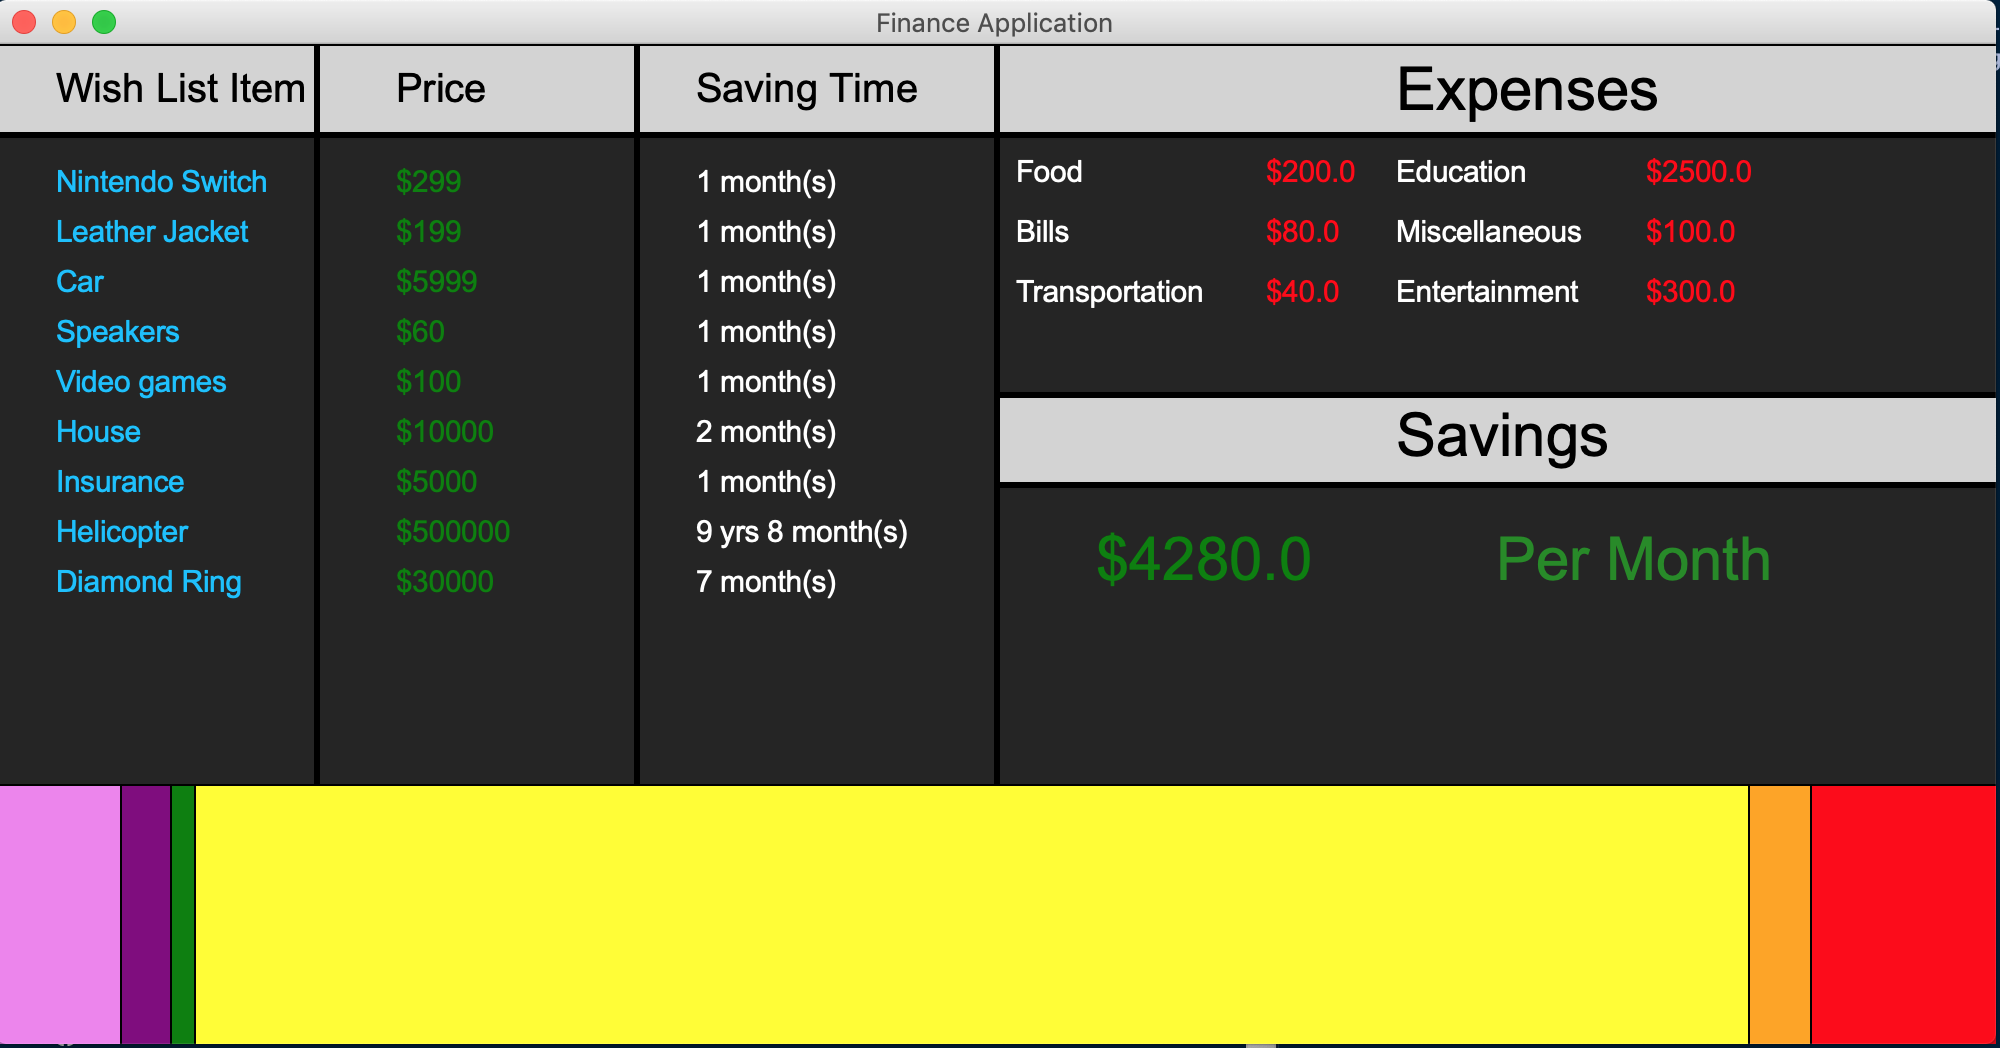
Screenshots
Demo Input

Demo Output